Boatswain Agent 0.2.12 is released!
Earlier this week we have released a new version of Boatswain (Agent version 0.2.12). Please follow this update guide for different Linux distros. If you are running Boatswain as a container, just use the 0.2.12 image available from Docker Hub.
The new Period attribute
In this release, we have added a new configurable attribute called Period which is the collection time interval of the Server Host and the Docker metrics. Here is the new /etc/boatswain.yml looks like:
|
|
Prior to agent version 0.2.12, the collection time interval is 10s and there is not way to control it.
Now, as stated in the above config file, there are 3 available options for the new Period attribute and default would be used if this attribute is missing.
The command flag for config file is updated too
When running Boatswain directly through the binary as a foreground process, we could specify the location of the config file using the -f flag (instead of -t prior to agent version 0.2.12).
|
|
Server resources consumption VS Period
Setting a longer period means the statistics shown on the Boatswain web portal would have a less sample size but in return, it could reduce system load significantly. Moreover, it could free more data space for monitoring more Docker servers without hitting our BETA 2GB data limit.
Let’s run Boatswain to monitor itself with different Period settings. Here are the three runs on a Digital Ocean droplet (1vCPU, 1GB Memory) and it hosts a Drupal 7 application. Each run lasts for 30 mins.
Note: The data size below only includes the metrics which depend on the Period setting.
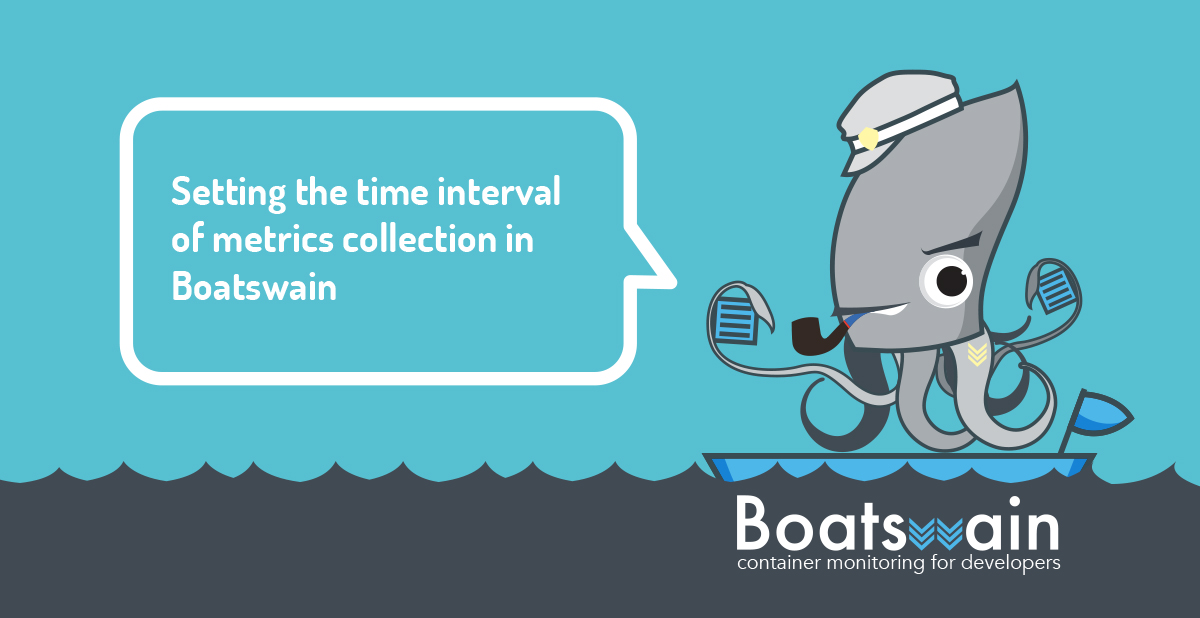
Period: short (10s)
|
|
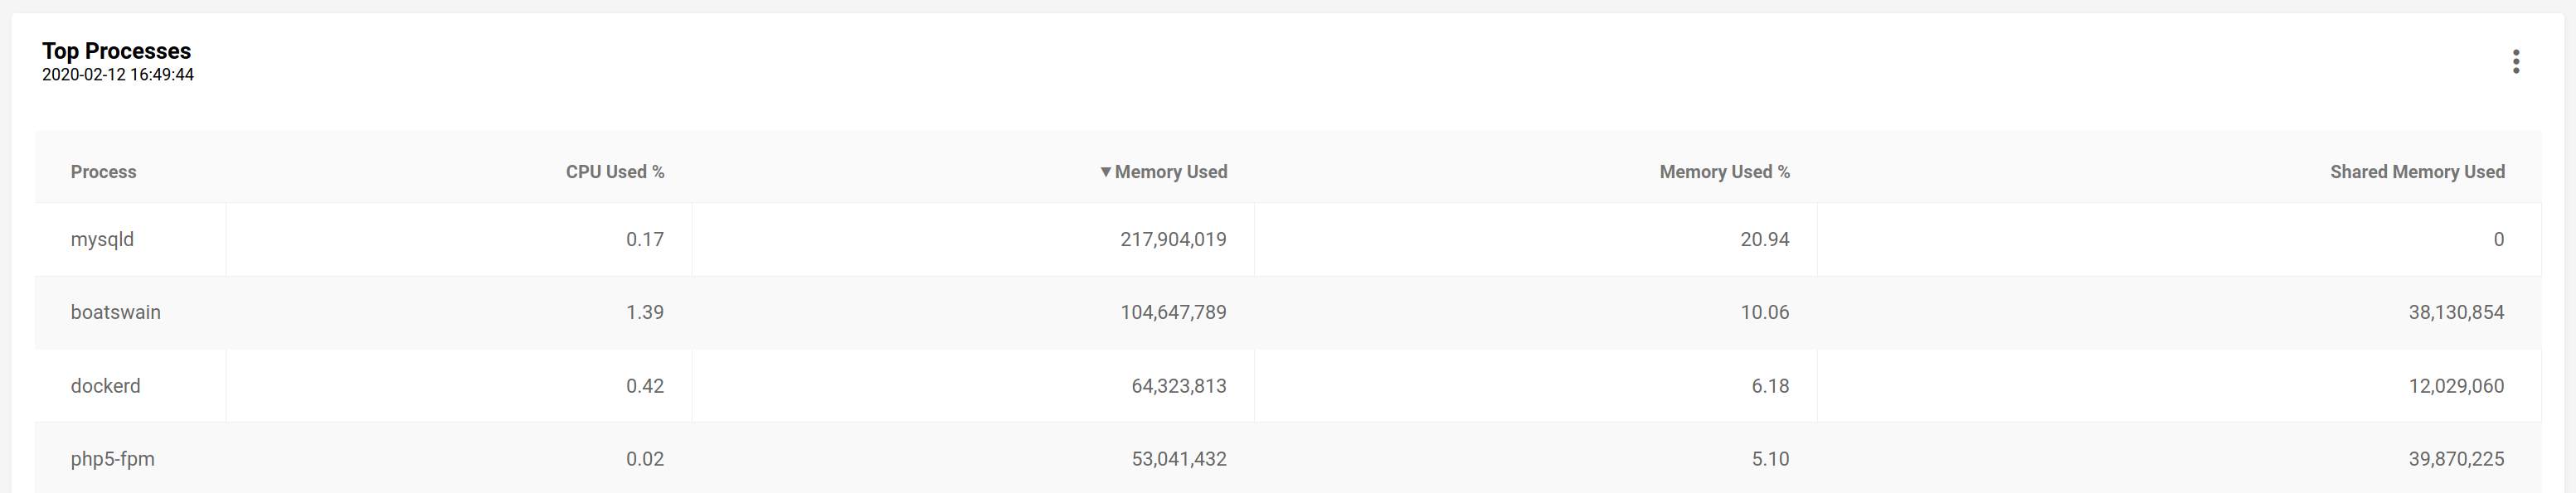
Period: default (30s)
|
|
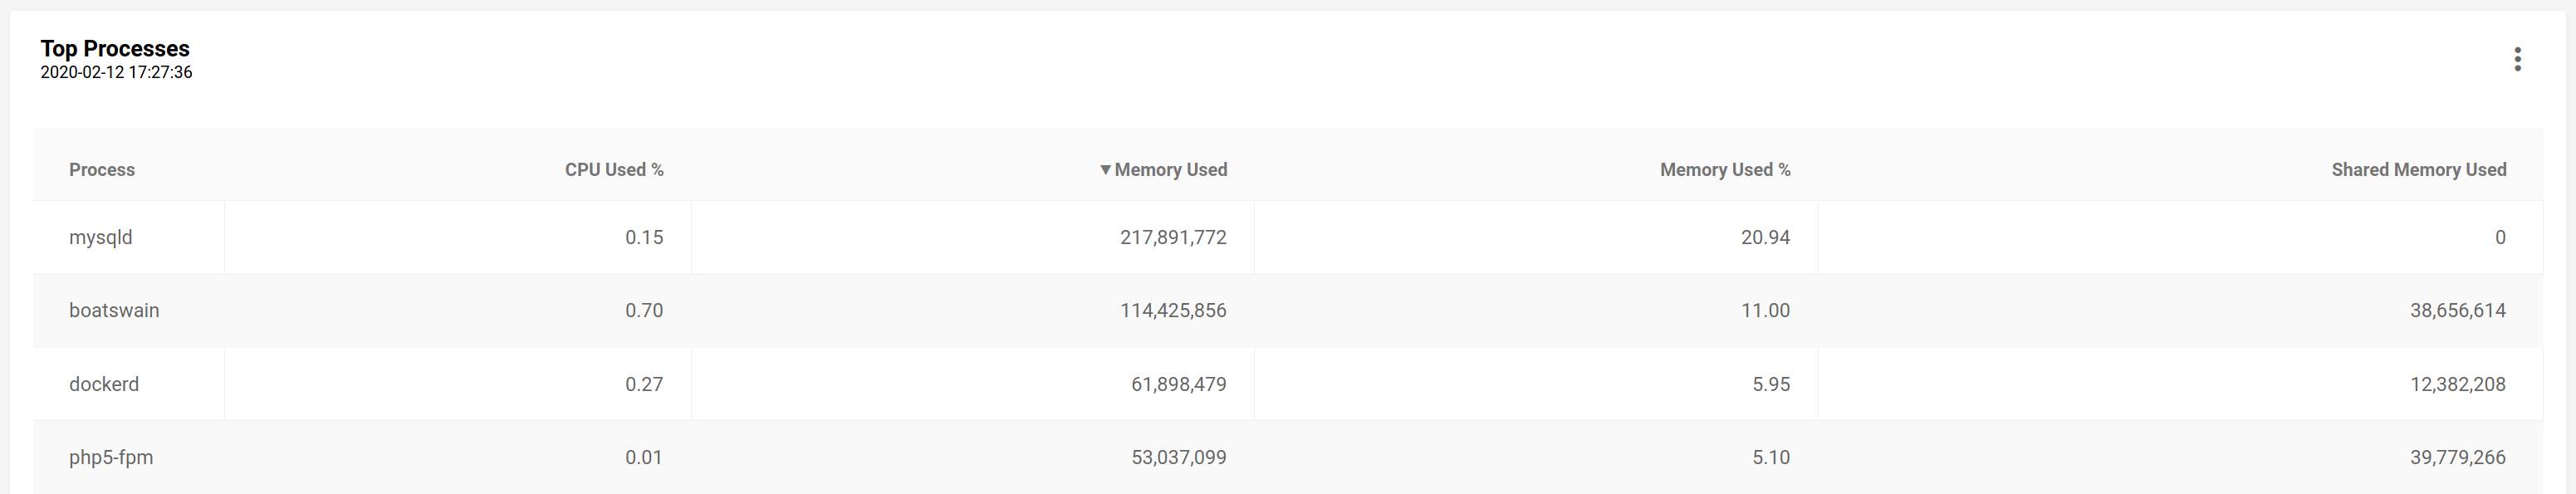
Period: long (60s)
|
|
Result
- CPU consumption dropped significantly.
- 49.64% from 1.39% to 0.70% (Period: 10s 30s)
- 58.99% from 1.39% to 0.57% (Period: 10s 60s)
- Memory consumption was more or less the same.
- Although the value dropped a lot (Period: 10s 60s), it raised to 11.90% (123,901,542 Bytes) after running 6 hours.
- Data size dropped significantly.
- 51.14% from 8.8MB to 4.3MB (Period: 10s 30s)
- 78.41% from 8.8MB to 1.9MB (Period: 10s 60s)
Other metrics
Boatswain also collects other metrics including
- Container Status
- Container Logs
- Web Analytics
They are independent of the new Period attribute as the logs and web analytics metrics are received in real time while the container status is monitored in a fixed 10s time interval.
What’s next?
It has been more than one year since our BETA-I release and Boatswain looks more complete after the recent updates. Probably it’s time to move on.
Stay tuned with us!